ng-peity: Tiny SVG Charts for Angular—No jQuery Required
May 19, 2026
ng-peity
Some UI problems do not need a charting library the size of a small framework.
You want a sparkline in a table cell. A donut next to a KPI. A bar strip that ticks every second so a dashboard feels alive. Full D3 or Chart.js would be overkill—and in 2014, when I first shipped an AngularJS wrapper around Peity, the whole point was exactly that: turn a comma-separated string into an SVG in one line of markup.
A decade later, dashboards are bigger, Angular is unrecognizable, and jQuery is no longer the default passenger in every front-end stack. The idea, though, is the same. I rebuilt the project as ng-peity: standalone Angular components on Angular 19+, wired to peity-vanilla so you get Peity’s look and API without pulling jQuery back in.
What you get
Four chart types, each a small standalone component:
| Selector | Chart |
|---|---|
ng-peity-pie | Pie |
ng-peity-donut | Donut |
ng-peity-bar | Bar |
ng-peity-line | Line |
Bind a required data array and optional options (radius, colors, width, height, stroke, and the rest of the Peity options). When either input changes, the chart redraws. Resize is handled too—ResizeObserver on the host element plus a debounced window resize listener—so sparklines survive responsive layouts without you writing glue code.
import { Component, signal } from '@angular/core';
import { NgPeityBarComponent, NgPeityPieComponent } from 'ng-peity';

@Component({
  selector: 'app-dashboard',
  imports: [NgPeityPieComponent, NgPeityBarComponent],
  template: `
    <ng-peity-pie [data]="pieData()" [options]="pieOptions()" />
    <ng-peity-bar [data]="barData()" [options]="barOptions()" />
  `,
})
export class DashboardComponent {
  readonly pieData = signal([12, 8, 15, 6]);
  readonly pieOptions = signal({ radius: 48 });

  readonly barData = signal([5, 3, 9, 6, 5]);
  readonly barOptions = signal({ width: 120, height: 40 });
}
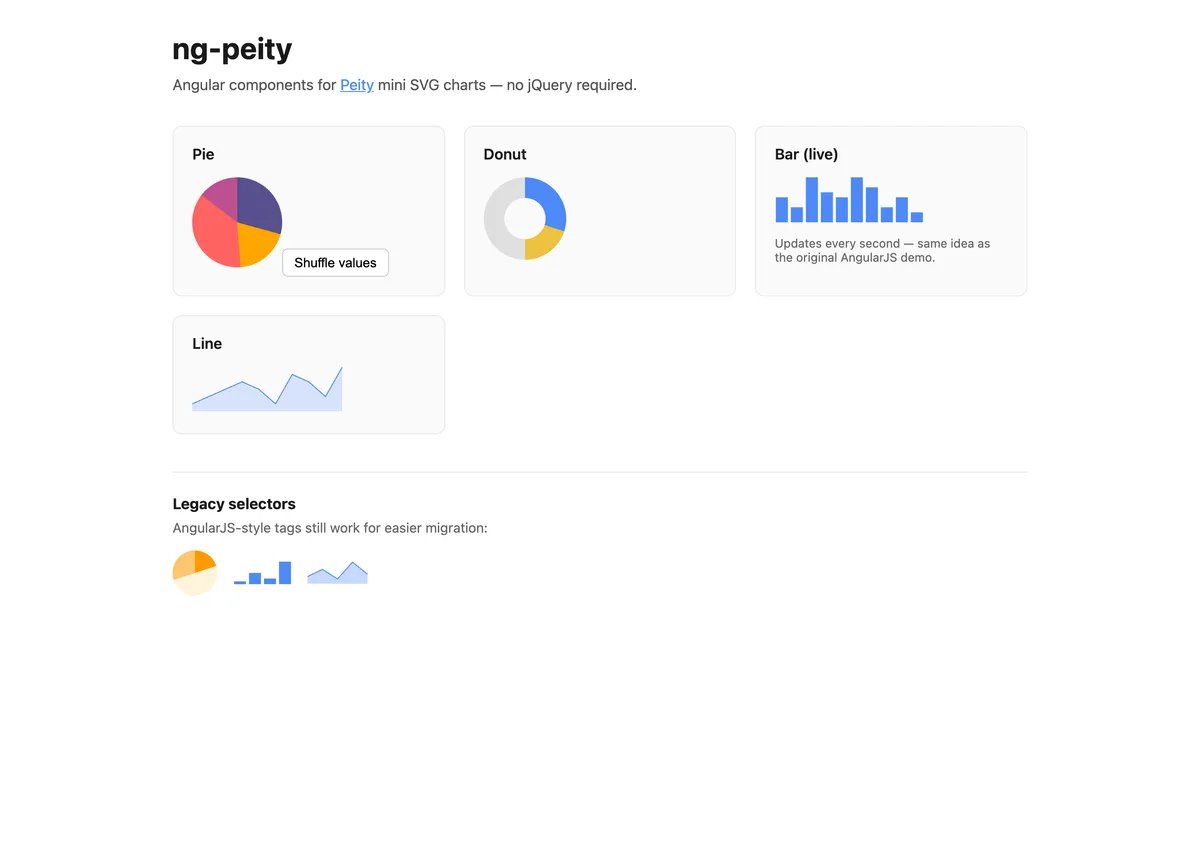
The demo app is deliberately boring in a good way: four cards, one live bar chart, and a Shuffle values button on the pie so you can see updates without opening DevTools.
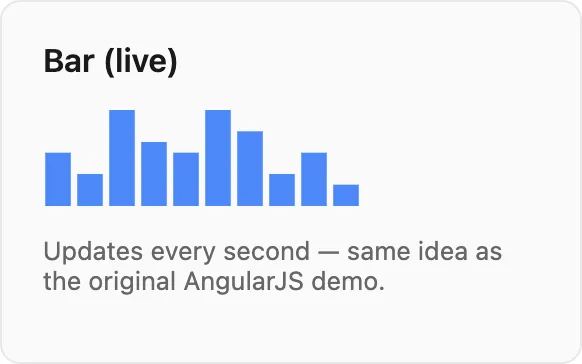
The live bar chart (still my favorite demo)
The original AngularJS Plunker pushed a random value every second, shifted the array, and randomized the bar fill color. It was the quickest proof that Peity was not a static screenshot generator.
The modern demo does the same with signals:
private readonly intervalId = window.setInterval(() => {
  const next = Math.round(Math.random() * 10);
  this.barData.update((values) => [...values.slice(1), next]);
  this.barOptions.update((opts) => ({
    ...opts,
    fill: [`#${Math.floor(Math.random() * 0xffffff).toString(16).padStart(6, '0')}`],
  }));
}, 1000);
No magic in the library here—just reactive data and a component that redraws when inputs change. That separation is intentional: ng-peity stays a thin adapter; your app owns the stream of numbers.
How the adapter works
All four components extend a shared PeityChartBase directive class. On first render they:
- Set the host
<span>text to a comma-separated list of numbers (Peity’s expected input format). - Call
createPeityChart()frompeity-vanilla. - Register Angular
effect()hooks ondata()andoptions()to update text, merge options, and calldraw().
effect(() => {
  const values = this.data();
  if (!this.peityInstance) return;
  this.host.nativeElement.textContent = values.join(',');
  this.peityInstance.draw();
});
peity-vanilla does not ship TypeScript types, so the runtime import is isolated in peity-runtime.ts with a single @ts-expect-error—the rest of the library stays strictly typed.
Each component also registers legacy selectors on the same class, so migration from AngularJS is mostly a template and module import change, not a rename of every tag in your app.
From AngularJS 1.x to Angular 19
In November 2014 I published ng-peity.js: a tiny angular.module with a factory that generated inline-pie-chart, inline-bar-chart, and inline-line-chart directives, jQuery + jquery.peity in the bundle, and scope bindings for data and options. It was inspired by Brian Hines’s angular-peity; the README lived on a Plunker and Bower was how you installed it.
That code still lives under legacy/ in the repo—header comment, debounced resize, and all.
The new package keeps the old element names as aliases:
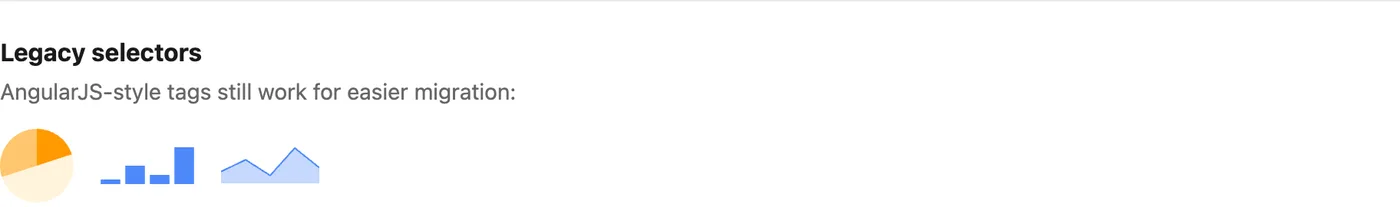
inline-pie-chart→ng-peity-pieinline-donut-chart→ng-peity-donutinline-bar-chart→ng-peity-barinline-line-chart→ng-peity-line
You bind [data] and [options] the same way; you just use signal or property bindings instead of data="PieChart.data" scope strings.
When to reach for ng-peity (and when not to)
Reach for it when you need inline, lightweight SVGs—admin tables, status rows, compact cards, or “show me the last N points” without axes, legends, or export buttons.
Reach for something else when you need interaction (zoom, brush, tooltips on every point), multiple coordinated series, or accessibility features that go beyond a simple SVG. Peity was never trying to be Grafana.
Try it
git clone https://github.com/maggiben/ng-peity.git
cd ng-peity
npm install
npm start
Open http://localhost:4200 for the demo. To use the library in your own app:
npm install ng-peity peity-vanilla
(peity-vanilla is a direct dependency of ng-peity; you normally only need the Angular package.)
Build the library with npm run build (output in dist/ng-peity). The demo production build is npm run build:demo.
I did not set out to maintain a chart library for ten years. I set out to stop copy-pasting Peity wiring into every Angular project. If you still have comma-separated numbers and a spare <span>, ng-peity is the modern version of that habit—small charts, signal-driven updates, no jQuery.